
Computers for Class 7 Kids
Introduction
In this article, you will be able to know and learn about some essential terminologies, MCQ, and Q&A that are frequently asked while learning and teaching class 7 computer science. The article includes Number System (Chapter 1), Formulas and Functions in Excel (Chapter 2), and Creating Charts in Excel (Chapter 3).

Click the link given below to download
Terminologies
Spreadsheet
· Spreadsheet refers to a computer program that represents information in a two-dimensional grid of data, along with formulas that relate to the data.
· A spreadsheet is designed to hold numerical data and short text strings.
· A spreadsheet can capture, display, and manipulate data arranged in rows and columns.
· Some common examples of spreadsheet programs are Google Sheets (online and free), LibreOffice-calc (free), Microsoft Excel, and OpenOffice- calc (free).
Microsoft Excel
· Microsoft Excel is a spreadsheet program that is used to save and analyze numerical data.
· Microsoft Excel allows calculation or computation capabilities, graphing tools, pivot tables, and a macro programming language called Visual Basic for applications.
· Microsoft Excel is a commonly used Microsoft Office application developed by Microsoft for Windows, macOS, Android, and iOS.
Workbook
A workbook refers to a file in which multiple worksheets are stored.
Worksheet
· Worksheet is a collection of cells organized in rows and columns in which you can enter and calculate data.
· A worksheet is always stored in a workbook.
MS-Excel Formula
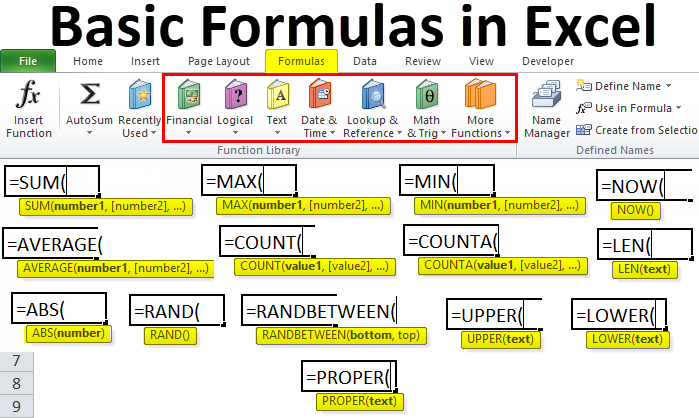
MS-Excel Formula refers to a sequence of values, cell references, functions, and operators in a cell that produces a new value from existing values.
Concatenation
Concatenation refers to the joining of two or more text values together.
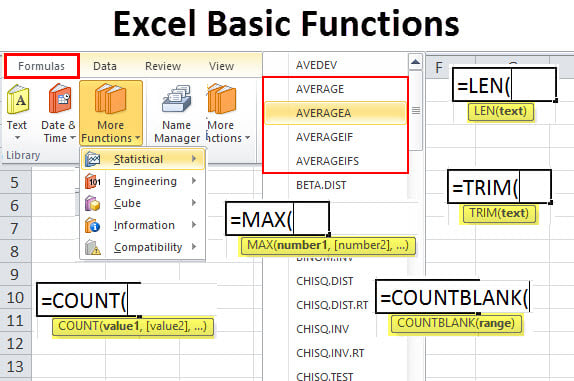
Functions
Mixed reference
· Mixed reference refers to a combination of relative and absolute cell references.
· In a mixed reference, either a row or a column number remains constant.
Charts in MS-Excel
Charts in MS Excel refer to the pictorial representation of worksheet data.
Chart area
· Chart area refers to the area in which the chart and all its components are displayed.
· Chart area is surrounded by a border.
Plot area
Plot area refers to the area of the chart in which data is plotted.
Gridlines
Gridlines refer to the horizontal or vertical lines that extend from the axes and run across the plot area.
Sparkline
Sparkline refers to a special feature of Excel 2010, which allows you to automatically draw a line graph in a cell indicating the trend in the values in different series.
MCQ
1. A byte consists of.......................... bits.
a. 8*
b. 10
c. 6
d. 12
2. In the computer, the information is expressed in ...........................
a. Words*
b. Sentence
c. Both a and b
d. None of these
3. Decimal number system has the base ..........................
a. 10*
b. 8
c. 12
d. 15
4. The .......................... number system consists of only two digits 0 and 1.
a. Binary*
b. Octal
c. Decimal
d. None of these
5. The octal number system has the base ..........................
a. 8*
b. 12
c. 15
d. 16
6. A range of cells is referenced using a ..........................
a. Colon (:)*
b. Asterisk (*)
c. Both a and b
d. None of these
7. .......................... is an example of cell references.
a. C3
b. B2:B5
c. B: E
d. All of these*
8. .......................... is an example of an MS Excel function.
a. SUM
b. AVERAGE
c. COUNT
d. All of these*
9. In MS-Excel, the mathematical operator used for the exponent is ...........................
a. ^*
b. *
c. /
d. None of these
10. .......................... function is used to display the current date in the selected cell.
a. Today()*
b. Day ()
c. Both a and b
d. None of these
11. $B7 is an example of.......................... referencing.
a. Absolute*
b. Mixed
c. Relative
d. None of these
12. .......................... chart is used to show changes in data over a period of time.
a. Column*
b. Pie
c. Line
d. Scatter
13. .......................... chart is used to plot only one data series.
a. Pie*
b. Line
c. Scatter
d. All of these
14. The .......................... is also known as the category axis.
a. x-axis*
b. y-axis
c. Both a and b
d. None of these
15. The .......................... is also known as the value axis.
a. y-axis*
b. x-axis
c. Both a and b
d. None of these
16. ........................... is a commonly used chart and is used to display data in the form of vertical bars.
a. Column*
b. Pie
c. Line
d. Scatter
17. ........................ is in the form of lines.
a. Line chart*
b. Pie
c. Scatter
d. All of these
18. A line chart uses ........................ to display trends in data over a period of time.
a. connecting dots*
b. connecting lines
c. curves
d. none of these
19. ........................... displays more than one data series.
a. Doughnut chart*
b. Line
c. Scatter
d. All of these
20. ........................ allows you to display data across a 3-D landscape.
a. Surface chart*
b. Line
c. Scatter
d. All of these
Q & A
Write different types of charts used in MS Excel.
The different types of charts used in MS Excel are column charts, line charts, bar charts, pie charts, doughnut charts, area charts, XY- scatter charts, surface charts, radar charts, and stock charts.
Write some advantages of using a chart.
· Charts present worksheet data in graphical and pictorial form, which is easier to read and understand.
· Charts help you to evaluate worksheet data and analyze them conveniently.
To know more visit https://zueducator.blogspot.com


No comments:
Post a Comment